HTTP Endpoint Monitoring
Customizable check intervals and request timeouts per service. Monitor any HTTP endpoint with expected status codes.
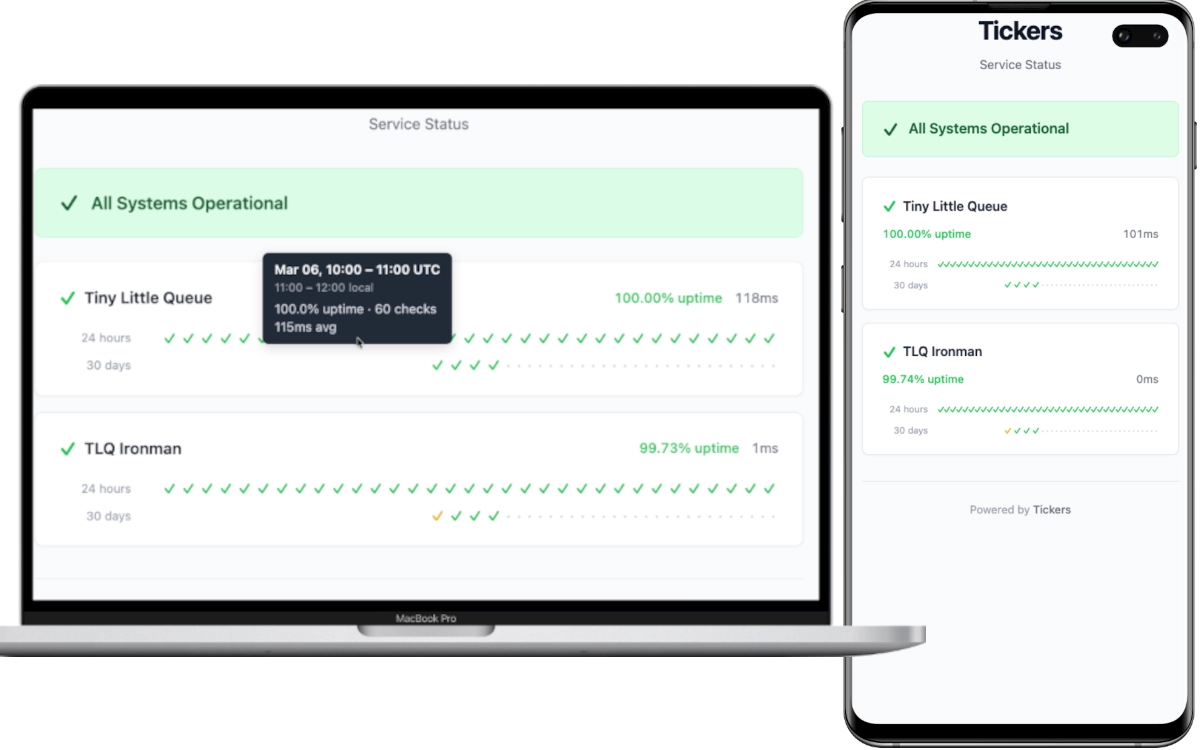
Monitor HTTP endpoints and display uptime with a visual tick mark interface. Single binary. SQLite. Docker ready.
Customizable check intervals and request timeouts per service. Monitor any HTTP endpoint with expected status codes.
Color-coded checkmarks from green to purple show uptime at a glance. Instantly see which services need attention.
24-hour hourly records and 30-day daily summaries. Track uptime trends and response times over time.
Rust backend serves the compiled WebAssembly frontend. One binary, no runtime dependencies, zero hassle.
WAL-mode SQLite database. No external database needed. Just mount a volume and go.
Multi-stage Docker builds and compose file included. Up and running in under a minute.
[server]
port = 8080

[defaults]
check_interval = 60
timeout = 10

[[services]]
id = "my-api"
name = "My API"
url = "https://api.example.com/health"
expected_status = 200

[[services]]
id = "my-website"
name = "My Website"
url = "https://example.com"
expected_status = 200services:
tickers:
image: ghcr.io/skyaktech/tickers:latest
ports:
- "8080:8080"
volumes:
- ./tickers.toml:/app/tickers.toml:ro
- tickers-data:/app/data
volumes:
tickers-data:docker run -d -p 8080:8080 \
-v ./tickers.toml:/app/tickers.toml:ro \
-v tickers-data:/app/data \
ghcr.io/skyaktech/tickers:latest
Then open http://localhost:8080 in your browser.